salaries





2015-16: Psychology Faculty Salaries
Peggy Christidis, Luona Lin and Karen Stamm
APA Center for Workforce Studies
Executive Summary
The College and University Professional Association for Human Resources (CUPA-HR) conducts annual compensation surveys for faculty in higher education. Salary data are broken down by several variables, including academic discipline, academic rank, tenure status, institution type, presence of collective bargaining units, and Carnegie Classification of the institution.
This report focuses on salaries collected by CUPA-HR for psychology faculty employed full-time in four-year colleges and universities during the 2015-16 academic year.
Introduction
The College and University Professional Association for Human Resources (CUPA-HR) is a non-profit organization that provides information, resources, advocacy, and connections in higher education. Its membership consists of over 20,000 HR professionals and other leaders in higher education at more than 1,900 member organizations worldwide.1 Membership is institution-based and includes approximately 93 percent of all U.S. doctoral institutions, 78 percent of all master's institutions, 56 percent of all bachelor's institutions and 600 two-year and specialized institutions.
Each year, CUPA-HR conducts compensation surveys for higher education. Academic institutions are asked to provide salary data for various professionals working in higher education, including administrators, department heads and faculty. In this report, we examine faculty salary data reported by CUPA-HR in its 2015-16 Faculty in Higher Education Salary Survey. This survey has been conducted for 35 years,2 and includes data for 241,491 full-time faculty at 743 U.S. institutions which participated in this year's survey.
Salaries for full-time faculty3,4 working in four-year colleges and universities are broken down by:
1) Academic discipline: academic disciplines are based on the Integrated Postsecondary Education Data System (IPEDS) Classification of Institutional Programs (CIP) Codes.5
2) Academic rank: professor, associate professor, assistant professor, new assistant professor6 and instructor/lecturer.
3) Tenure status: tenured/tenure-track and non-tenure-track.
4) Type of institution: private and public (with and without collective bargaining units).
5) Carnegie Classification: the Carnegie Classification system is a framework for categorizing colleges and universities in the United States, and refers primarily to the highest degree awarded by that institution.7 In this report, psychology salaries are broken down by the following Carnegie Classifications: research universities,8 other doctoral,9 master’s and baccalaureate.
Although CUPA-HR collects salary data for 32 disciplines, this report focuses primarily on the salaries earned by psychology faculty (CIP code 42). Salaries for psychology faculty were collected by CUPA-HR and are presented throughout this report. All tables and figures presented in this report are derived from summary data provided by CUPA-HR. Table 1 (PDF, 237KB) displays the number of faculty and institutions that provided salary data for psychology, broken down by academic rank and tenure status.10
Table 1. Number of Faculty and Institutions that Provided Salary Data for Psychology by Academic Rank and Tenure Status, 2015-16
* The rank of New Assistant Professor was used only for tenured/tenure-track faculty.
* The rank of New Assistant Professor was used only for tenured/tenure-track faculty.
Salary Increases for Psychology Faculty between 2014-15 and 2015-16
Table 2 (PDF, 270KB) presents mean salaries for full-time tenured/tenure-track faculty for the 2014-15 and 2015-16 academic years.11 Salaries are broken down by academic rank and Carnegie Classification of the institution. In 2015, the annual Consumer Price Index for all urban consumers (CPI-U) was approximately 2.1 percent higher than in 2014.12 When salaries earned in 2014 were adjusted for inflation using the Consumer Price Index data for the year 2015, the increases in mean salaries for psychology faculty between 2014-15 and 2015-16 were greater than they were between 2013-14 and 2014-15.13 Salaries increased across all academic ranks and Carnegie Classifications.
Table 2. Mean Salaries for Tenured/Tenure-Track Psychology Faculty by Academic Rank and Carnegie Classification of Institution (Constant and Adjusted Dollars), 2014-15 and 2015-16
Figure 1 (PDF, 380KB) illustrates the percent change in mean salaries between the 2014-15 and 2015-16 academic years, broken down by academic rank and Carnegie Classification of the institution. Collapsed across all institutions, psychology faculty in each academic rank saw increases in their salaries. Specifically, professors saw an increase of 1.7 percent; salaries for associate and assistant professors increased by 2.1 percent, and salaries for psychology instructors rose by 3.3 percent.
New assistant professors working at institutions classified as “other doctoral,” experienced the largest increases in mean salaries (8.7 percent). At 0.3 percent, the smallest increase in salary between 2014-15 and 2015-16 was for new assistant professors employed at master’s institutions. Despite the range, psychology faculty from all academic ranks and Carnegie classifications saw greater increases in their salaries between 2014-15 and 2015-16 academic years, than they did between 2013-14 and 2014-15 (where in some cases, salaries actually decreased).14
Figure 1. Percent Differences in Mean Salaries for Tenured/Tenure-Track Psychology Faculty by Academic Rank and Carnegie Classification of Institution, 2014-15 to 2015-16
Note: Salaries for the 2014-15 academic year were adjusted for inflation using the Consumer Price Index data for the year 2015.
Note: Salaries for the 2014-15 academic year were adjusted for inflation using the Consumer Price Index data for the year 2015.
Tenured/Tenure-Track Salaries for Psychology Faculty, 2015-16
The following section displays salary data for full-time, tenured/tenure-track psychology faculty for the 2015-16 academic year. Tables and figures illustrate mean salaries broken down by academic rank (professor, associate professor, assistant professor, new assistant professor, and instructor), institution type (private versus public), and the presence or absence of collective bargaining units at public institutions.
Salaries by Academic Rank and Institution Type
As expected, psychology professors on average earned the highest salaries across all types of institutions (Mean=$94,218), while instructors earned the least (Mean=$52,924). However, Figure 2 (PDF, 257KB) displays an overlap in salaries across academic ranks, due to a wide range of salaries within each rank. In particular, the range of salaries for professors was quite large ($35,071 to $471,031).15
Figure 2. Mean Salaries and Salary Ranges for Tenured/Tenure-Track Psychology Faculty by Academic Rank, 2015-16
Table 3 (PDF, 270KB) displays mean salaries for tenured/tenure-track psychology faculty, for each academic rank and by private versus public institution type. In general, tenured/tenure-track psychology faculty employed at public institutions had higher mean salaries than psychology faculty at private institutions.16,17. The only exception was for instructors, who earned slightly more at private (Mean=$53,367) than at public (Mean=$52,688) institutions.
Table 3. Mean Salaries for Tenured/Tenure-Track Psychology Faculty by Academic Rank and Institution Type, 2015-16
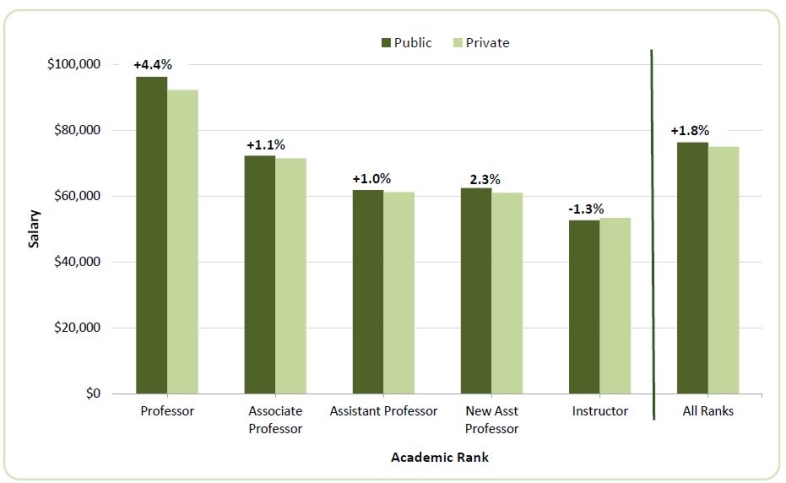
Figure 3 (PDF, 337KB) shows that when collapsed across all academic ranks, tenured/tenure-track psychology faculty employed at public institutions earned approximately $1,336 or 1.8 percent more than psychology faculty at private institutions. On average, professors at public institutions earned $4,027 or 4.4 percent more than professors at private institutions, and new assistant professors earned $1,426 or 2.3 percent more than their counterparts employed at private institutions. Mean salaries for associate professors at public (Mean=$72,262) and private (Mean=$71,493) institutions differed only by one percent, as did salaries for assistant professors at public (Mean=$61,832) versus private (Mean=$61,219) institutions. Instructors earned $679 (or 1.3 percent) less at public institutions than at private institutions.
Figure 3. Percent Differences in Mean Salaries for Tenured/Tenure-Track Psychology Faculty by Academic Rank and Institution Type, 2015-16
Note: Comparison between mean salaries of tenured/tenure-track Instructors in public versus private institutions may be unreliable due to small sample size.
Note: Comparison between mean salaries of tenured/tenure-track Instructors in public versus private institutions may be unreliable due to small sample size.
Collective Bargaining
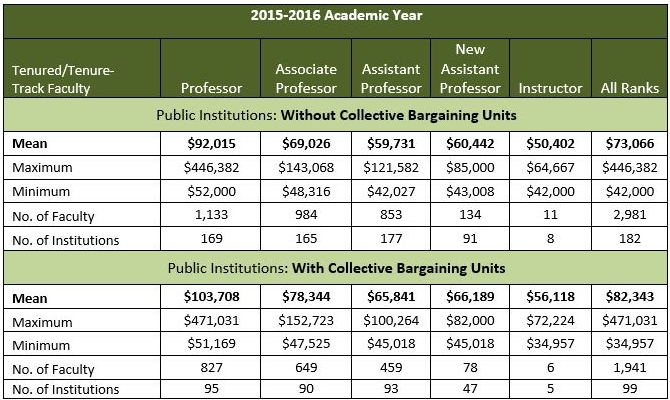
The presence of a collective bargaining unit in public institutions had a direct effect on the salaries earned by tenured/tenure-track psychology faculty.18 Table 4 (PDF, 276KB) illustrates that salaries were consistently higher across all academic ranks for psychology faculty at public institutions with collective bargaining units.19
Table 4. Mean Salaries for Tenured/Tenure-Track Psychology Faculty by Academic Rank for Public Institutions with and without Collective Bargaining Units, 2015-16
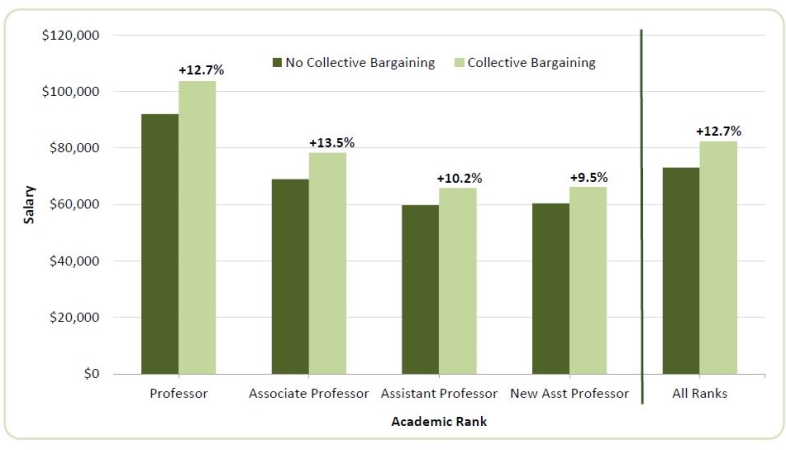
As demonstrated in Figure 4 (PDF, 260KB), tenured/tenure-track psychology faculty working in public institutions with collective bargaining units earned between 9.5 to 13.5 percent more than their counterparts at non-unionized public institutions. Collapsed across all academic ranks, the mean salary of psychology faculty at public institutions with collective bargaining units (Mean=$82,343) was $9,277 or 12.7 percent higher than that of faculty working at public institutions without collective bargaining units (Mean=$73,066).
Figure 4. Percent Differences in Mean Salaries for Tenured/Tenure-Track Psychology Faculty Employed at Public Institutions with and without Collective Bargaining Units, 2015-16
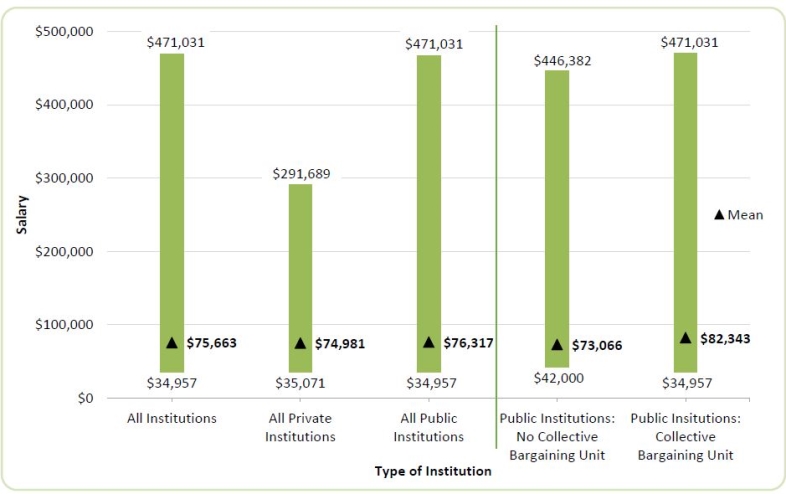
Figure 5 (PDF, 263KB) displays the mean salaries and salary ranges for tenured/tenure-track psychology faculty by type of institution. When comparing across all academic ranks for faculty in private versus public institutions, the mean salary for faculty at public institutions (Mean=$76,317) was $1,336 higher than the mean salary for faculty at private institutions (Mean=$74,981). However, when public institutions were separated further by those that were unionized and those that were not, non-unionized psychology faculty employed at public institutions earned approximately 2.6 percent less (Mean=$73,066) than psychology faculty at private institutions. In contrast, psychology faculty at public institutions with collective bargaining units earned 9.8 percent more (Mean=$82,343) than faculty at private institutions. These findings suggest that the presence of collective bargaining units plays an important role in the salaries earned by tenured and tenure-track psychology faculty.
Figure 5. Mean Salaries and Salary Ranges for Tenured/Tenure-Track Psychology Faculty by Type of Institution, 2015-16
Note: Salaries in this figure are collapsed across academic ranks (i.e., professor, associate professor, assistant professor, and new assistant professor).
Note: Salaries in this figure are collapsed across academic ranks (i.e., professor, associate professor, assistant professor, and new assistant professor).
Non-Tenure-Track Salaries for Psychology Teaching Faculty, 2015-16
This section displays salary data for full-time, non-tenure-track psychology teaching faculty for the 2015-2016 academic year. Non-tenure-track is defined as “individuals whose faculty appointments do not carry the commitment or expectation of permanent tenure.”20
Salaries by Academic Rank and Institution Type
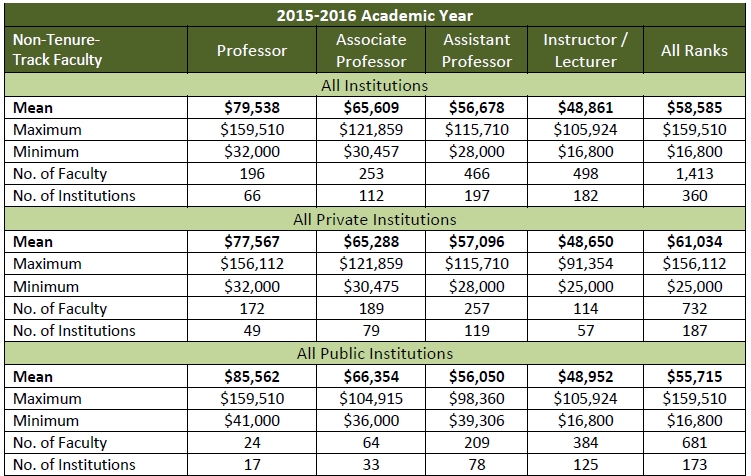
Table 5 (PDF, 273KB) illustrates mean salaries broken down by academic rank and institution type. When collapsed across all academic ranks, non-tenure-track psychology teaching faculty employed at private institutions earned $5,319 or 9.5 percent more than psychology faculty employed at public institutions.
Table 5. Mean Salaries for Non-Tenure-Track Psychology Teaching Faculty by Academic Rank and Institution Type, 2015-16
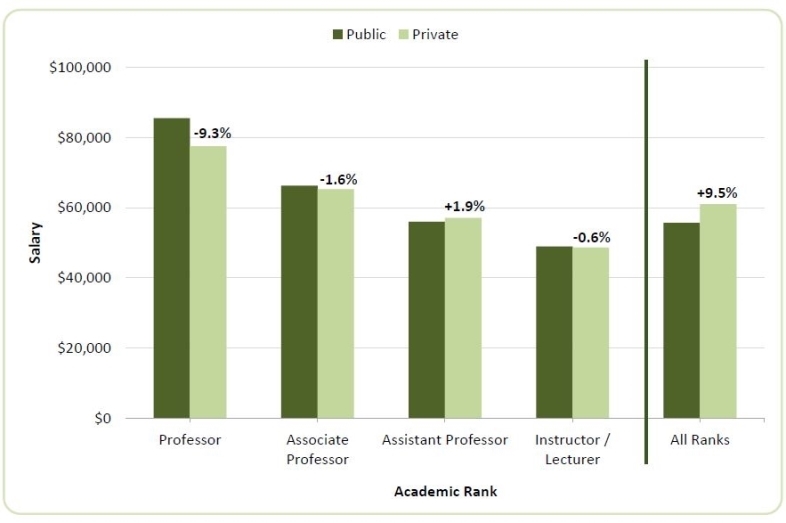
Although non-tenure-track psychology faculty employed at private institutions earned approximately 9.5 percent more than faculty at public institutions across all ranks, mean salaries broken down by academic rank tell a different story. Figure 6 (PDF, 257KB) shows that professors, associate professors, and instructors actually earned less at private institutions (9.3 percent, 1.6 percent, and 0.6 percent less, respectively).21 The only exception was for non-tenure-track assistant professors, who earned $1,046 or 1.9 percent more at private institutions (Mean=$57,096) than public institutions (Mean=$56,050).
Figure 6. Percent Differences in Mean Salaries for Non-Tenure-Track Psychology Teaching Faculty by Academic Rank and Institution Type, 2015-16
Collective Bargaining
Table 6 (PDF, 274KB) displays salaries for non-tenure-track psychology faculty at public institutions, broken down by the presence or absence of collective bargaining units. As with tenured/tenure-track faculty, non-tenure-track psychology faculty at public institutions with collective bargaining units earned more than non-tenured-faculty employed at public institutions without collective bargaining units.
Table 6. Mean Salaries for Non-Tenure-Track Psychology Teaching Faculty by Academic Rank for Public Institutions with and without Collective Bargaining Units, 2015-16
Figure 7 (PDF, 260KB) shows the percent difference in salaries for non-tenure-track psychology faculty by the presence or absence of collective bargaining units. For non-tenure track faculty, psychology professors at public institutions with collective bargaining units earned $22,671 or 33.1 percent more than professors at public institutions without collective bargaining units. Associate professors earned 3.8 percent more, assistant professors earned 10.6 percent more, and instructors earned 20.1 percent more. Collapsed across all academic ranks, psychology faculty at public institutions with collective bargaining units earned $9,227 or about 17.5 percent more than psychology faculty at non-unionized public institutions.
Figure 7. Percent Differences in Mean Salaries for Non-Tenure-Track Psychology Teaching Faculty Employed at Public Institutions with and without Collective Bargaining Units, 2015-16
Comparison of Non-Tenure-Track Faculty Salaries to Tenured/Tenure-Track Faculty Salaries
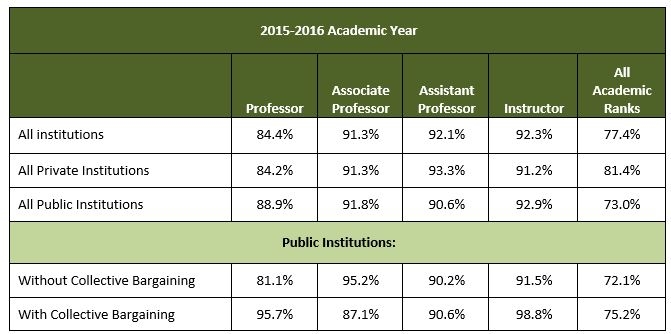
As shown in Table 7 (PDF, 266KB), for all academic ranks combined, non-tenure-track faculty earned less than tenured/tenure-track faculty. Collapsed across academic rank and institution type (i.e., private versus public), non-tenure-track faculty earned approximately 77.4 percent of the mean salaries earned by tenured/tenure-track faculty.
At private institutions, the mean salary for non-tenure-track faculty was 81.4 percent of the mean salary earned by tenured/tenure-track faculty. Likewise, the mean salary for non-tenure-track faculty at public institutions was 73.0 percent of that earned by tenured/tenure-track faculty. This pattern of results was found for each academic rank.
Table 7. Percentages of Mean Tenured/Tenure-Track Psychology Faculty Salaries Earned by Non-Tenure-Track Psychology Teaching Faculty, 2015-16
Note: A comparison between tenured and non-tenured New Assistant Professors could not be made since CUPA-HR coded this academic rank only for tenured/tenure-track faculty.
Note: A comparison between tenured and non-tenured New Assistant Professors could not be made since CUPA-HR coded this academic rank only for tenured/tenure-track faculty.
Psychology Faculty Salaries Compared to Other Disciplines
Psychology versus Other Social Sciences
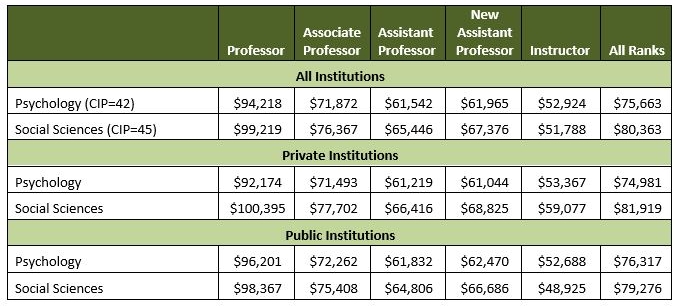
How do psychology faculty salaries compare to the salaries of faculty in other disciplines? For example, are psychology faculty salaries comparable to salaries earned by faculty in other social science disciplines? Table 8 (PDF, 338KB) illustrates mean salaries for tenured/tenure-track faculty in psychology versus faculty employed in other, non-psychology social science disciplines, broken down by academic rank and institution type. Specifically, Table 8 (PDF, 338KB) compares salaries for faculty that fall under CIP code 42 (psychology) versus CIP code 45 (social sciences).22 Overall, psychology faculty earned less than faculty in other social science disciplines. Collapsed across academic rank and institution type, psychology faculty earned $4,700 or 6.2 percent less than other social sciences faculty. This pattern was found for both public and private institutions, although the salary differences were slightly less for faculty at public institutions. On average, psychology faculty earned $6,938 or 9.3 percent less than social science faculty at private institutions, and $2,959 or 3.9 percent less than social sciences faculty at public institutions.
Table 8. Mean Salaries for Tenured/Tenure-Track Psychology Faculty and Faculty in other Social Science Disciplines by Academic Rank and Institution Type, 2015-16
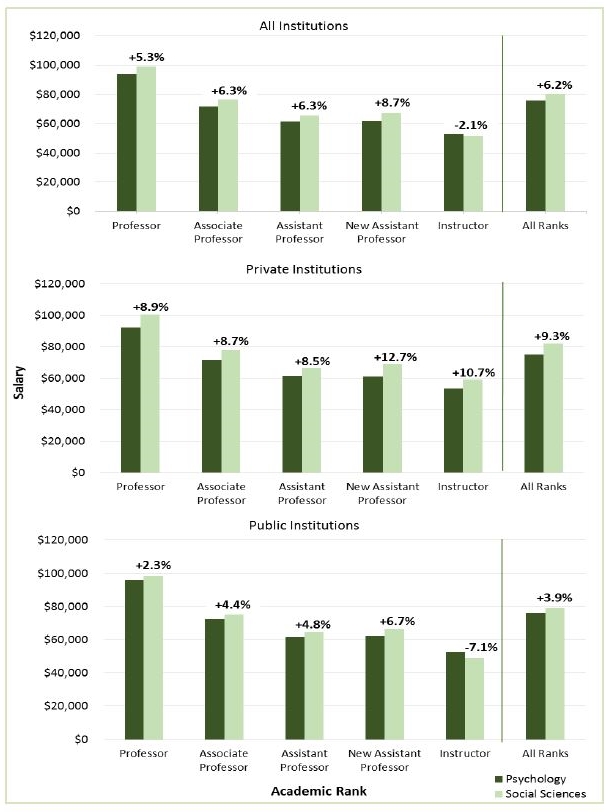
Figure 8 (PDF, 221KB) displays the percent differences in mean salaries between tenured/tenure-track faculty in psychology and other social science disciplines. Social sciences faculty earned 6.2 percent more on average, across all academic ranks and institution types. This pattern was found for both private (9.3 percent) and public institutions (3.9 percent).
Figure 8. Percent Differences in Mean Salaries for Tenured/Tenure-Track Psychology Faculty and Faculty in other Social Science Disciplines by Academic Rank and Institution Type, 2015-16
Psychology versus other STEM, STEM-Related and Non-STEM Disciplines
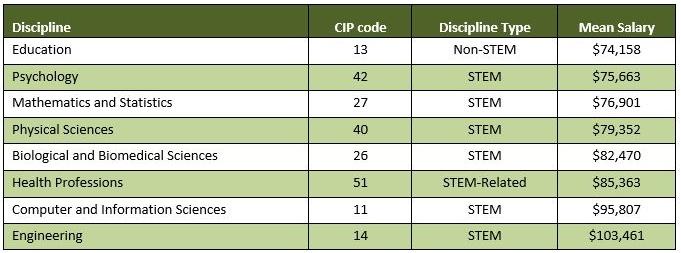
How do salaries for psychology faculty compare to salaries earned by faculty in other science, technology, engineering, and mathematics (STEM)23 disciplines, as well as related disciplines where faculty with psychology doctorates are often employed, such as health professions (STEM-related)24 or education (non-STEM)? Table 9 (PDF, 264KB) displays mean salaries for tenured/tenure-track faculty working in psychology, other STEM-disciplines, and related fields, collapsed across academic rank, institution type and Carnegie Classification of the institution. Compared to other STEM disciplines, psychology faculty tended to earn less. Specifically, psychology faculty earned between $1,238 (psychology versus mathematics and statistics) and $27,798 (psychology versus engineering) less than faculty in other STEM disciplines.
On average, psychology faculty earned approximately $1,505 more than education faculty (Mean=$75,663 and $74,158 respectively). In contrast, engineering faculty tended to earn much more (Mean=$103,461) than psychology faculty.
Table 9. Mean Salaries for Tenured/Tenure-Track Faculty in Psychology and Faculty in other STEM, STEM-Related, and Non-STEM Disciplines, Collapsed Across Academic Rank, Institution Type, and Carnegie Classification of Institution, 2015-16
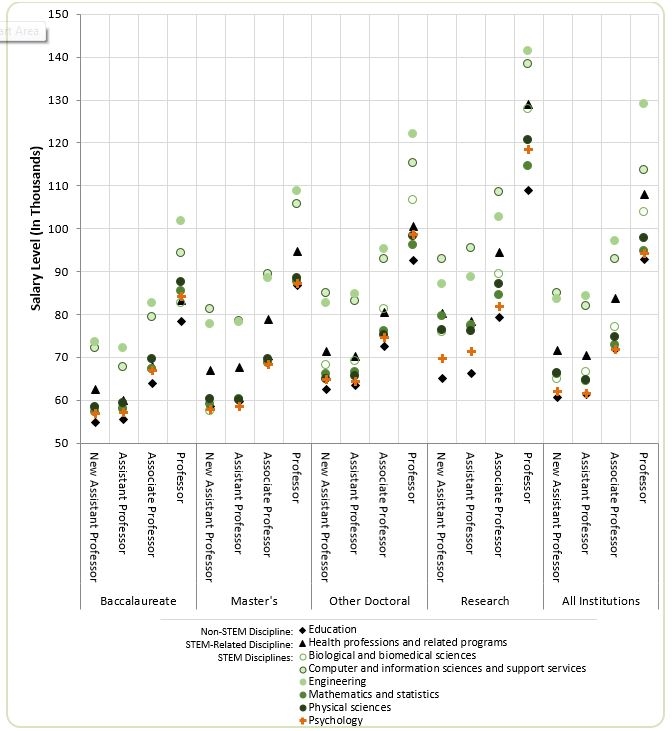
Figure 9 (PDF, 291KB) shows psychology faculty salaries (+) relative to faculty salaries in other STEM, STEM-related, and non-STEM disciplines, broken down further by academic rank and Carnegie Classification of the institution.
Figure 9. Mean Salaries for Tenured/Tenure-Track Psychology Faculty and Faculty in other STEM, STEM-Related and Non-STEM Disciplines by Academic Rank and Carnegie Classification of Institution, 2015-16
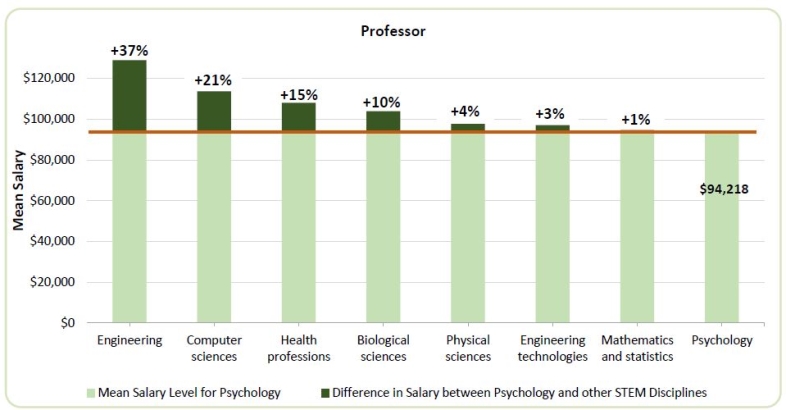
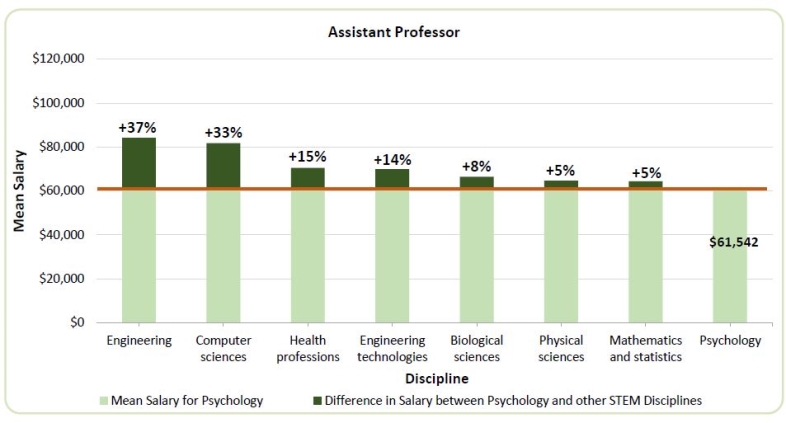
Figures 10 (PDF, 261KB), 11 (PDF, 337KB) and 12 (PDF, 336KB) illustrate the percent differences in mean salaries between psychology faculty and faculty in other STEM or STEM-related (i.e., health professions) disciplines. For each academic rank, psychology faculty earned less than faculty in other STEM disciplines. The most striking differences in mean salaries were between psychology and computer sciences and engineering. Across all ranks, engineering faculty earned 35-37 percent more than psychology faculty, and computer science faculty earned between 21-33 percent more than psychology faculty.
Figure 10. Percent Differences in Mean Salaries between Psychology Professors and Professors in other STEM and STEM-Related Disciplines, 2015-16
Figure 11. Percent Differences in Mean Salaries between Psychology Associate Professors and Associate Professors in other STEM and STEM-Related Disciplines, 2015-16
Figure 12. Percent Differences in Mean Salaries between Psychology Assistant Professors and Assistant Professors in other STEM and STEM-Related Disciplines, 2015-16
Conclusion
The 2016 CUPA-HR Survey for Four-Year Colleges and Universities provided faculty salary data for 32 disciplines. Based on these survey data, the primary focus of this report was on salary data collected for psychology faculty. Salaries were broken down by variables such as academic rank, tenure status, institution type, Carnegie Classification of the academic institution, and the presence or absence of collective bargaining units. Comparisons were also made between psychology faculty salaries and faculty salaries in other social sciences. Additional comparisons were made between psychology faculty salaries and salaries earned by faculty in other STEM disciplines, as well as faculty employed in related disciplines, such as health professions (STEM-related) and education (non-STEM).
A comparison of tenured/tenure-track faculty salaries from 2014-15 and 2015-16 revealed that salaries for certain academic ranks and Carnegie classifications did not always increase at the same rate as inflation. Even so, compared to previous years – where salaries remained relatively stagnant or even decreased slightly – mean salaries for the 2015-2016 academic year increased for all academic ranks.
In general, tenured/tenure-track psychology faculty employed at public institutions had slightly higher mean salaries than psychology faculty at private institutions. When collapsed across all academic ranks, tenured/tenure-track psychology faculty employed at public institutions earned approximately 1.8 percent more than psychology faculty at private institutions. Unlike tenured/tenure-track faculty, non-tenure-track psychology faculty employed at private institutions earned 9.5 percent more than psychology faculty employed at public institutions. However, when broken down by academic rank, most non-tenure-track faculty actually earned more on average at public than private institutions, especially professors, who earned 10.3 percent more at public institutions. Nevertheless, these findings for non-tenure-track faculty should be interpreted cautiously, considering the sample sizes for non-tenured professors and associate professors were quite small.
Tenured/tenure-track psychology faculty earned more than non-tenure-track faculty, across all academic ranks. Collapsed across academic rank and institution type (i.e., private versus public), non-tenure-track faculty earned approximately 77.4 percent of the salaries earned by tenured/tenure-track faculty.
The presence of a collective bargaining unit in public institutions played a very important role in determining the salaries earned by psychology faculty. Salaries were consistently higher across all academic ranks for psychology faculty whose public institution had a collective bargaining unit. This pattern of results was found for both tenured/tenure-track and non-tenure-track faculty.
Tenured/tenure-track psychology faculty earned less on average than faculty in other social sciences. This pattern was found across all academic ranks, and for both public and private institutions. Although psychology is a STEM discipline, psychology faculty positions tended to pay less than faculty positions in other STEM disciplines. One reason for these findings may be due to the larger presence of women in psychology, compared to other social sciences and STEM disciplines. Future research may further examine the relationship between salaries and the prevalence of female faculty in various social science and STEM disciplines. Unfortunately, one limitation of the CUPA-HR survey is that gender and race/ethnicity data for faculty in higher education were not collected.25
Another limitation of the data is that although an institution may be classified by the Carnegie Foundation as “doctoral” or a “research university,” it is difficult to determine if the types of doctorates awarded at that institution include doctorates in psychology. Although most institutions classified as doctoral granting do award psychology doctorates, there is no simple way to determine if all doctoral-granting institutions in the CUPA-HR sample offer psychology doctorates.
Finally, although this report focuses on variables such as academic rank, tenure status, Carnegie Classification, and presence of collective bargaining units, CUPA-HR also collects additional data that are available through its “DataOnDemand” tool. This tool allows users to conduct peer comparison groups or breakdowns of faculty salaries by variables such as geographic location of institution, student size, level of instruction (i.e., undergraduate, graduate, or both), NCAA division and more. Although these variables were not available to APA for this report, they will be made available for future versions.26
Footnotes
- Member organizations are primarily colleges and universities. For more information about CUPA-HR, see http://www.cupahr.org/.
- This survey was previously known as the “National Faculty Salary Survey.”
- Professors, associate professors, assistant professors and instructors working at least 75 percent full-time equivalent, have annual contracts or appointments of at least 9 months, and whose teaching/research are more than 50 percent of their duties.
- Adjunct faculty was not included in CUPA-HR’s survey for Four-year Colleges and Universities.
- The U.S. Department of Education, National Center for Education Statistics designed the CIP code system to provide a taxonomic scheme that supports the tracking, assessment and reporting of fields of study and program completions activity. A full listing of CIP codes can be found at https://nces.ed.gov/ipeds/cipcode/browse.aspx?y=55.
- CUPA-HR defined a new assistant professor as a new hire for the academic year being surveyed (this academic rank was used only for tenured/tenure-track faculty).
- For more on the Carnegie Classification system, see http://carnegieclassifications.iu.edu/lookup_listings/standard.php.
- Institutions that grant doctoral degrees and have high or very high research activity. The categorization comes from two indices of research activity, which is based on principal component analysis of factors including research expenditures, number of research doctorates awarded, number of research-focused faculty, and other factors. For more information, see http://carnegieclassifications.iu.edu/methodology/basic.php.
- Institutions that grant doctoral degrees but are less research intensive than research universities.
- For tenured/tenure-track faculty: Counts for new assistant professors were also included in the assistant professor cells. Therefore, the “All Ranks” total was calculated by adding “professor” + “assoc prof” + “assist prof” + “instructor” – “new asst prof.”
- All salaries collected by CUPA-HR are for U.S. psychology faculty employed on a 9/10-month basis.
- For more information on 2015 Consumer Price Index numbers for all urban consumers (CPI-U), see http://www.bls.gov/cpi/cpid1512.pdf.
- Constant dollars for the 2014-15 academic year were adjusted for inflation using the Consumer Price Index data for the year 2015, see http://www.bls.gov/data/inflation_calculator.htm.
- For more information on psychology faculty salaries for the 2014-15 academic year, see http://www.apa.org/workforce/publications/15-cupa-hr/report.pdf
- $471,031 may be an outlier that represents psychology faculty who also have higher administrative positions such as provost or president, and may not be representative of non-administrative psychology professor positions.
- The only exception was for instructors, who earned 12.5 percent more on average at private (Mean=$58,272) than public (Mean=$51,788) institutions. However, this result may be due to low sample size. The CUPA-HR sample for tenured/tenure-track instructors consisted of only eight private institutions and 10 public institutions.
- Means in this table and every table that follows in this report are unweighted.
- Public and private institutions are covered by different labor laws. In a 1980 decision (NLRB v. Yeshiva University), the U.S. Supreme Court ended faculty collective bargaining at private institutions (although recent lower court rulings have allowed for it in some cases). For more information, see https://supreme.justia.com/cases/federal/us/444/672/.
- Data are reported only for positions having at least five responding institutions.
- As defined by CUPA-HR Faculty in Higher Education Salary Survey for the 2015-16 Academic Year: By Discipline, Rank and Tenure Status in Four-Year Colleges and Universities. Non-tenure-track psychology teaching faculty may include individuals with specific teaching expectations outside of the normal tenure expectations of teaching.
- Caution should be taken when interpreting these results, because sample sizes for non-tenured faculty were small, especially for professors (N=17) and associate professors (N=33) employed at public institutions.
- Social science disciplines such as political science, economics, sociology, anthropology, and geography do not have their own individual CIP codes. Instead, they are combined together in CIP code [45]: Social Sciences.
- STEM disciplines include computer science, mathematics, engineering, biological sciences, physical sciences and social sciences (which includes psychology).
- Health professions are identified as “STEM-related” by the U.S. Census Bureau and includes dentists, chiropractors, clinical/medical laboratory services, optometry, veterinary medicine, mental/social health services, nursing and others. For additional information, see https://www.census.gov/prod/2013pubs/acs-23.pdf and https://nces.ed.gov/ipeds/cipcode/cipdetail.aspx?y=55&cipid=88742
- However, future CUPA-HR reports on faculty salaries plan to include gender and race-ethnicity data.
- For more information on CUPA-HR’s DataOnDemand tool, see http://www.cupahr.org/surveys/dod.aspx