Showing posts with label matlab. Show all posts

Friday, July 11, 2014

Publish Your MATLAB Analysis to Your Blog

reposted from


Publish Your MATLAB Analysis to Your Blog

Posted by Loren Shure

I have been posting blogs about MATLAB with code examples for many years. Steve Eddins, my fellow blogger of Steve on Image Processing fame, developed and maintains an internal tool that automates a lot of tasks and I rely on it to publish my blog posts.
One of my guest bloggers, Toshi Takeuchi, showed me a new tool he found, and he would like to do a quick introduction.

Contents

Why publish to a blog?

Hi, it's Toshi again. If you use MATLAB for fun like me, you would probably like to publish your work to share with other people. I do web analysis in marketing and I can tell you there are many people like you out there, based on the increasing search volume forpersonal use of MATLAB.
I have been writing to our internal WordPress blog service, and most of my posts involve MATLAB code examples. I would first do my analysis in MATLAB, then add commentary to explain what I did, and then publish it to HTML. After that, I had to manually copy and paste the published text and code to WordPress – and the process is tolerable but isn’t particularly easy.
I recently started contributing, as a guest blogger, some of my personal posts for Loren who maintains her public-facing blog. The other day I had a chance to witness how she posts her blogs. While her process was much more efficient than mine, I started wondering if we could do even better.
I suspect that this may be a widely shared pain. So I dug around a bit, and I found this wonderful MATLAB module called matlab-wordpress by John Kitchin on GitHub.

Installation

Installation was very straight forward. I just downloaded the zip file, added the extracted folder to the MATLAB search path, and jar files to javaclasspath, as described in README.md.

Enable Remote Publishing

Next, enable XML-RPC (Enable the WordPress, Movable Type, MetaWeblog and Blogger XML-RPC publishing protocols) in your admin console. This is under:
  Settings -> Writing -> Remote Publishing

Credentials

You can avoid entering your username and password for your inside WP account if you set up blogCredentials.m as described in README.md.
user = 'your blog username';
password = 'your blog password';
server = 'http://your-blog/xmlrpc.php';

Add a plot to your MATLAB file

If you include an image or generate a plot in your MATLAB code, then the image will be automatically uploaded to the Media Library automatically. Sweet!
figure
hist(randn(1000,1),20)
title('Normal Distribution with \mu=0, \sigma=1')

Add a link to a file for Download

Let's say you want to link to a .mat file used in your post, and the file path should be defined relative to the location of the MATLAB file you are publishing. If it is in the same location as your MATLAB file, you can link to it as follows:
"You will need to :download:`sample.mat` for this example."
This will then translates to:
"You will need to download sample.mat for this example."
The file will be automatically uploaded to the same directory that holds all your images and the URL will be updated to reflect the new file location. This alone will save tons of hassle. Unfortunately this may not work if your WordPress server is not configured to accept nonmedia files like .mat files.

Link to another post on your blog

You can add a link using MATLAB Markup syntax, but matlab-wordpress also gives you an ability to link to another post on your blog. Since Loren doesn't have this MATLAB module, you won't see the effects of these next sections in this post.
"In :postid:`920` we discussed how to analyze Twitter with MATLAB..."

Add a tooltip

You can add a tooltip like this.
:tooltip:`<this is the tooltip.> Hover on this`

Add notes and warnings

You can also add color to text to draw attention to a note or warning.
:note:`This is a note in light blue.`
:warning:`This is a warning in pink.`

Add categories and tags to the post

You can add categories and tags to your post if you include the following lines in your code. Currently it appears you can only add one of each, for some reason.
% categories: Blog
% tags: MATLAB

Publish to WordPress

Now it's time to publish your MATLAB file to WordPress. If your MATLAB file is myFile.m, then you enter the following command in the command window.
   blogpost myFile.m
Perhaps you want to publish locally first as a dryrun. If so, instead do:
  blogpost myFile.m true % set |dryrun| parameter to |true|

Updating your post

When you publish your post, your post ID and permalink is automatically added to the MATLAB file. If you update your file, you can update your blog post by simply typing blogpost myFile.m again. If you remove your post ID from your MATLAB file, that will result in a new post.

Conclusion

Because I happen to use WP-Syntax plugin on my blog for syntax highlighting, I have to remove the CSS tags generated bypublish from MATLAB and make other adjustments related to that. If you can use the MATLAB generated CSS as is, then my guess is that you don't have to do any additional tweaks.
Even though I still had to do some cleaning, the overall process took a lot less time than the manual process I use. Mileage may vary depending on your settings, but I think this is going to be useful for many people. Let us know how it works for you here.

Get the MATLAB code 

Published with MATLAB® R2014a


Sunday, July 6, 2014

COSMO 2012

http://klab.smpp.northwestern.edu/wiki/index.php5/CoSMo_2012

Friday, April 18, 2014

KML2STRUCT – Easily Import Your KML Files


reposted from


KML2STRUCT – Easily Import Your KML Files

Posted by Sean de Wolski


Sean's pick this week is kml2struct by James Slegers.

Import Your KML Files

Earlier this week, my friend sent me a Google Maps link containing our hiking tracks recorded with the GPS on his smart phone. From Google Maps you can download the data as a KML (Keyhole Markup Language) file.
I wanted to plot it and experiment with the data in MATLAB. Once again, the File Exchange was there for me!
% Read the KML file into a struct:
kmlS = kml2struct('2014-04-12PresidentialTraverse.kml');

% Convert to table (new datatype in R2013b) to make manipulations easier
kmlT = struct2table(kmlS);
Now looking at the table, we can see the four important pieces:
  • Geometry: What is it? A point, line, etc.
  • Lon: Longitude coordinate of tracks
  • Lat: Latitude coordinate of tracks
  • Bounding Box: Bounding box if we want to draw it on a map
First, I'll get the bounding box of the whole trip. To do this, we'll stack each segment's bounding box into the third dimension and then pick the min and the max:
boxes = kmlT.BoundingBox; % Extract Bounding box from table
boxes3d = cat(3,boxes{:}); % Stack along third dimension
bbox = [min(boxes3d(1,:,:),[],3); max(boxes3d(2,:,:),[],3)].'; % Min and max along third dimension give limits
latlim = bbox(2,:)+[-0.01 0.01]; % Buffer them
lonlim = bbox(1,:)+[-0.01 0.01];
Next, I only want to work with the lines, i.e. the actual tracks. The points represent termini, which I don't need right now. Using the new categorical data type and logical indexing, we can extract the latitude and longitude from the table.
% Make Geometry categorical
kmlT.Geometry = categorical(kmlT.Geometry);

% Extract the latitude and longitude for the lines
latlon = kmlT{kmlT.Geometry=='Line', {'Lat','Lon'}};
I'll get the elevation data from NASA using the Web Map Service in the Mapping Toolbox.
nasaLayers = wmsfind('nasa*elev', 'SearchField', 'serverurl');
ned = refine(nasaLayers, 'usgs_ned');
[Z, refmatZ] = wmsread(ned, 'Latlim', latlim, 'Lonlim', lonlim);
Z = double(Z);
And finally, plot a contour map with the tracks overlaid on it.
figure
ax = usamap(latlim, lonlim);
geoshow(Z, refmatZ, 'DisplayType', 'texturemap')
contourm(Z, refmatZ, 20, 'Color', 'k')
demcmap(Z)
title('Presidential Traverse 04/12:13/2014','FontSize',16)

% Add each segment
for ii = 1:length(latlon)
    geoshow(latlon{ii,:}, 'LineWidth', 2)
end

Comments

Have you ever recorded a trip and then tried to analyze it in MATLAB? The tasks above would be more straight-forward if you had access to the original GPX files. These typically come with the elevation data and time stamps allowing you to get even more statistics with more accuracy.
Give it a try and let us know what you think here or leave a comment for James.

Get the MATLAB code 

Published with MATLAB® R2014a

    Sunday, February 23, 2014

    python???

    reposted from


    HELLO PYTHON

    Share via email
    Share
    Previously, I made the decision to transition away from Matlab towards Python. Converting over to a new language is a big deal and there are many questions and issues to be addressed. In the future I will get a bit more detailed and discuss how I set up and use my Python environment – there seems to be many options here. But for now, I will just highlight the advantages of Python as I see it at the moment.
    #1. It’s free. Any data/code I release, associated with a paper for example, can be examined by pretty much anyone who wants to do so.
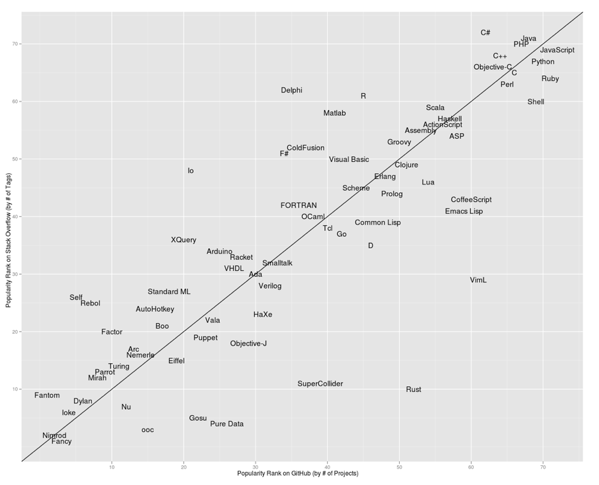
    #2. It is very popular and many people are actively developing cool stuff. Ranked by number of projects on GitHub and StackOverflow we can see that it’s among the big boys, with R and Matlab looking on enviously.
    rankings-redmonk-february
    And here is a nice little talk about the rise in popularity of Python, and a discussion of its future.

    #3. iPython. As far as I can tell, iPython is a completely novel way of producing, executing and sharing code. It is developed by scientists who want a more productive, open, and efficient workflow. In short, it allows you to write, document, and execute your code within your internet browser, complete with inline graphics. These form notebooks which can be highly readable documented code (with Markdown formatting of text and LaTeX equations, and embedded images and video) that other people can see and execute – ideal for sharing code and making your work transparent. I’ll write more about the advantages of this in the future, but see this short introductory video.

    #4. There are complete, ready to use, reliable packages that will let me do what I want. This is not some sketchy half-working collection of beta software. The big ones that I know I will be using are:
    SciPy, which is actually a collection of packages including some below, as well as a set of functions for file IO, statistics, linear algebra, optimisation, etc.
    Numpy for fun with N-dimensional arrays.
    Pandas, which provides more data structures, such as DataFrames which are used in R.
    Matplotlib, for plotting. They have a great gallery of examples, and just taking a look you can find examples such as this that are very hard (if not impossible) to do in Matlab.
    PyMC or PyStan for conducting MCMC inference with probabilistic models.

    Some interesting things to a present/ex Matlabber

    KWARGS.

    Modules and Packages. A module is a file called something like myfunctions.py. And it could contain a number of different function definitions (as opposed to just one function per file in Matlab). I imagine this will bias your code to consist of more, but shorter functions. In order for Python to know about the module and the functions within, then you need to import the module (e.g. import myfunctions.py). The nice thing about a module is that it can also contain code that executes when it is imported. A good example would be to import dependencies.
    As far as I can tell, packages are collections of multiple modules, and these could be loaded independently.
    Modules and packages are good because it keeps things neat, tidy and which make loading dependent modules easier. This contrasts with the Matlab approach of just adding lots of paths to your environment. Good luck bundling up some code that you might want to send to someone and then setting up the paths on their machine.

    More stuff, but for the future

    And just by way of showing the breadth of directions this could go in, here are some toolboxes to use when I’ve got a bit more confidence with Python:
    • In terms of running psychophysics experiments, switch from Psychtoolbox (for Matlab) and use PsychPy.
    • Speed up computational intense code with either Numba or Cython or play with GPU computing with PyOpenCL.
    Finally, Python has nothing to do with snakes. Its name was inspired from Monty Python.